
OWASP FSTM, step 8: Runtime analysis
Table of Contents

Static analysis of the firmware and its executables provides only a limited amount of information about its operation and performing further analysis at that stage is inefficient in time and effort. Because of this, it is often necessary to continue the analysis in a dynamic environment, where the firmware and its components can be observed and manipulated in execution. Runtime analysis builds on the previous phases to gain access to the system’s executables and internal processes, either in a real environment through administrator access or in a virtualized environment, built specifically for the executables of this firmware and where there is much more control over execution.
In case of running the system on the original hardware, without emulation, it is necessary to obtain administrator or debugging access to continue with this phase of the analysis, in addition to having the debugging and instrumentation tools to be used available on the system.
If administrator access is not possible or the original hardware is not available, an isolated virtual environment with all the tools, files and libraries necessary for the executables to be analyzed can be built. This environment can be built with chroot or similar tools and allows greater control over the entire process, although it is more error prone and requires a greater investment in time and effort.
This article discusses the different tools that can be used in the runtime analysis.
1. Main techniques for perform a runtime analysis
There are multiple techniques and tools that are useful for the dynamic analysis of an executable. The main categories are the following:
- Instrumentation and debugging: debuggers provide the ability to inspect the memory of a running process and to control its execution flow by placing breakpoints at strategic points in the code. Instrumentation is a technique that allows obtaining more information about a running process by injecting extra debugging code. In many cases, debugger functions require instrumentation to observe the state of a process.
- Tracing: consists of logging the events and system calls that occur during the execution of a process and can provide a fundamental outline of the operations being performed.
- Logging: the logs produced by the executable itself can provide a lot of information about errors and, in general, the state of a process.
2. Instrumentation and debugging
Instrumentation refers to a set of techniques used to monitor, measure, control and modify the execution of a piece of software. These are techniques that provide information for the analysis of the behavior of a program such as the time it takes to execute, the state of the memory it accesses… These techniques are used with very different purposes, such as comparing the performance of different implementations of a program with the same task or monitoring the execution of a program to verify that there are no unwanted accesses to memory areas due to programming failures, etc.
Debuggers, using instrumentation techniques, are tools used to detect, identify, and check critical points in a program, either during software development or during a security analysis. Thanks to these tools, developers can easily diagnose the state of the software when bugs are found, speeding up fixes. The debugged code may be running on a simulator or on the device under study.
Debuggers can be of several types. The debugger can be a software tool, but it can also refer to a hardware tool that is used to program or download the firmware of a device, as seen in OWASP stage 2. These hardware debuggers are often accompanied by debugging software of their own.
Multiple alternatives of hardware debuggers, software, and other instrumentation software useful for dynamic analysis are listed below.
2.1. Hardware debuggers
Hardware debuggers can be based on several standards such as SWI, BDM or CADI although the most common hardware debug interface is JTAG. The term JTAG refers to the IEEE 1149 standard and its name is an acronym for Junction Test Action Group. The standardization appeared in 1985 by the European JETAG committee. It basically refers to a standard of hardware and software conditions to be met by debuggers and microprocessors.
According to the IEEE 1149 standard, a compatible device must have the following pins:
- TCK: clock for execution of debug commands.
- TMS: together with the rising edges of the clock determines the availability status of the debug port
- TDI: input of instructions and serial test data during debugging
- TDO: output of instructions and serial test data during debugging
Additionally, the state of the debug port driver may not be determined after startup. In that case, the device must have the following pin:
- TRST*: sets the debug port driver state to the reset position to synchronize hardware and software during execution.
Within the electronics development industry there are a multitude of debugging tools. Different hardware manufacturers offer a different answer to the need for debugging.
Software debuggers can be specialized in a specific development kit or be of general use. The specialized ones are usually developed by the development kit manufacturer and have limited capabilities, while the general-purpose ones are developed following a standard and have more functionalities. The following table shows some of the most popular hardware debuggers with their own software debugger:
| Manufacturer | Model | Hardware | Software Debugging |
|---|---|---|---|
| Segger | J-Link | Hardware debugger with support for ARM V7 and V8 architecture, mainly for the Cortex-M range | Proprietary software. J-Link application widely used and supported in most development IDEs |
| Microchip | ICP (Pic-Kit) | Hardware debugger with support for PIC architecture with 8-bit, 16-bit, 32-bit and DSP series support | Proprietary software. Application with support for the PIC family in most of the supported development IDEs |
| YIC System | OPENIce-A1000 | Debugger and Hardware Emulator with support for ARM Architecture V7, V10, and V11 mainly for the Cortex-A and Cortex-M range | Proprietary software. OPENIce-EDS application provides support for software emulation and debugging, can emulate a multitude of processors |
| Texas Instrument | TMDSEMU110-U (XDS1100) | Debugger and Hardware Emulator with support for ARM Architecture V7, V8 and V9 mainly for the Cortex-A, Cortex-R and Cortex-M range | Proprietary software. Proprietary IDE dbgjtag application updated for the XDS110 tool version |
| FTDI | FT2232HX | 2 in 1 USB multi-format hub with JTAG. Reconfigurable with JTAG / USART / I2C / SPI | OpenOCD open-source software. It is possible to debug on most open source or console interface IDEs |
| Microchip / Atmel | ICSP (UART+ RST) | Refers to the pin configuration and the standard applied to the 2×3 connector used on Atmel development boards. They are compatible with IEEE 1149 std and are generally controlled with a USART port | Open or closed source software, it supports the PIC-Kit debugger, OpenOCD, and extensive flashtools. It is the great flexibility of the hardware platform that has made it popular |
| Dangerous prototypes | BUS-Pirate | Multiformat debugger, USART, JTAG, SPI, I2C… It has hardware support for ARM V7, PIC ICP, ATMEL ICSP, etc | Open-source OCSP software. Supports generic configurations in various development IDEs and security analysis |
| ST Microelectronics | ST-Link | It refers to SWD’s own pin configuration (IEEE 1149.7) for the ST manufacturer and is compatible with most ARM V6, V7 and V8 micros of the Cortex-M and Cortex-R ranges, although the manufacturer does not assure compatibility with micros outside its ecosystem | Open and closed source debugging. It supports debugging with software such as J-Link or OpenOCD. This is a logical adaptation of the standard at the software level, but compatibility is not ensured outside the manufacturer’s own ST |
2.2. Software Debuggers
Software debuggers are a fundamental part of any development or security analysis task in the life of an IoT device. Nowadays the best hardware in the world is useless without the appropriate software that allows its full potential to be exploited. Examples include vehicles, telephone systems and even personal computers.
It is necessary to pause during this explanation and try to separate ideas that are very close to each other but are different parts of a whole. Inside the computer during debugging, there are two working parts that make up the debugger package. On the PC side there is on the one hand the J-Link debugging software (or the physical debugger of choice) that transforms the packets coming from the hardware device into complete data or frames. On the other side there is the debugger or debugging suite, such as GDB (or the one used by the environment chosen by the user for this task). Each of these parts must be configured separately.
GDB is the most widely used software debugger in both development and analysis tasks. It allows real-time instrumentation and debugging of almost any software and, although not usually associated with embedded systems development, it is often used. It allows injecting values and observing the operation of a complete firmware of an external machine at runtime. It is also possible to debug programs running inside an operating system by exposing it thanks to the location of its code in the section of RAM it occupies.
It is a command line tool, but there are multiple tools that act as a front-end for GDB and facilitate its use:
| Name | Supported languages | IDE | Operating System |
|---|---|---|---|
| gdbgui | C, C++, golang, Rust, Fortran | TUI | GNU-Linux, Windows (MinGW / Cygwin) |
| BVRDE | C, C++ | GUI | Windows |
| CLion | C, C++ | JetBeans GUI | GNU-Linux, MacOs, Windows |
| Eclipse CDT | C, C++ | Eclipse GUI | GNU-Linux, MacOs, Windows, StandAlone |
| Kdevelop | C, C++, Python, QML/JavaScript, PHP | Plasma GUI | GNU-Linux, FreeBSD, Solaris, MacOs, Windows |
| NetBeans | Java, C, C++, Fortran, Ensamblador | NetBeans GUI | GNU-Linux, MacOs, Windows |
| Nemiver | C, C++ | Gnome GUI | GNU-Linux |
| Pyclewn | C, C++ | Vim TUI | GNU-Linux |
| WinGDB | C, C++ | Visual Studio GUI | GNU-Linux, MacOs, Windows |
| CodeLite | C, C++ | GUI | GNU-Linux, FreeBSD, MacOs, Windows |
| QT Creator | C++ | QT GUI | GNU-Linux, MacOs, Windows |
| GNU EMACS | C, C++, golang, Rust, Fortran | Emacs TUI | GNU-Linux, FreeBSD, MacOs, Windows |
| SlickEdit | C, C++ | Slick Edit GUI | GNU-Linux, HP-UX, AIX, Solaris, MacOs, Windows |
| Lazarus | Free-Pascal | QT GUI | GNU-Linux, FreeBSD, MacOs, Windows |
| Seer | C, C++ | QT GUI | GNU-Linux |
In addition to the GDB interfaces, PEDA (Python Exploit Development Assistance for GDB) is a tool that extends the functionality of GDB to facilitate binary analysis tasks. It enhances visualization capabilities by coloring and displaying disassembled code, logs and memory information during the debugging process and provides an environment for executing commands that aid in exploitation. The following are some of the more interesting ones:
While it is true that it is not pure instrumentation software, thanks to this wide range of commands it is possible to do some tasks like those performed by traditional instrumentation tools.
patch — Patch memory start at an address with string/hexstring/int
pattern — Generate, search, or write a cyclic pattern to memory
procinfo — Display various info from /proc/pid/
pshow — Show various PEDA options and other settings
pset — Set various PEDA options and other settings
readelf — Get headers information from an ELF file
ropgadget — Get common ROP gadgets of binary or library
ropsearch — Search for ROP gadgets in memory
searchmem|find — Search for a pattern in memory; support regex search
2.3. Debugging example
A very common case for development and security analysis with physical devices is to simulate the physical device with a development board from the same manufacturer. A real case will be used to illustrate this fact. This is a high-performance device under analysis. Equipping a variant of the ARM-Cortex M4 micro from the manufacturer ST Microelectronics, model stm32F3xx. A NUCLEO-F303RE development board was acquired, this board integrates the ST-Link V2.1 debugger.
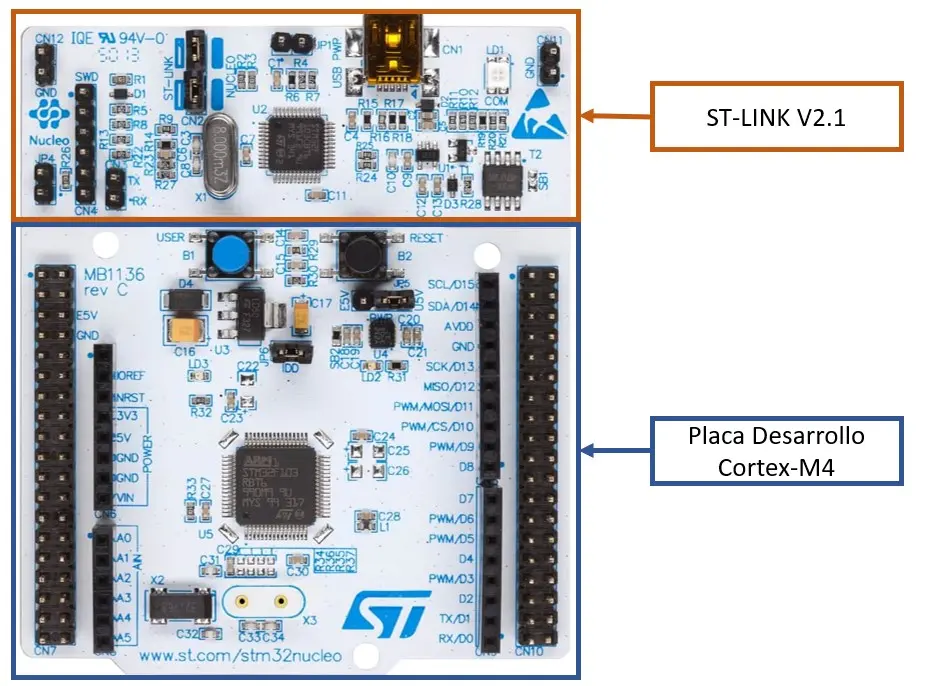
This board was made to work with OpenOCD, an open-source software debugger and the debugging was instrumented with GDB. We proceeded to debug the test program that flashes an LED.
$ openocd -f /usr/local/share/openocd/scripts/interface/stlink.cfg -f /usr/local/share/openocd/scripts/board/st_nucleo_f3.cfg
In the configuration of the stlink.cfg file the default port is 3333, so the command is launched:
$ gdb-multiarch
GNU gdb (GDB) 12.1
Copyright (C) 2022 Free Software Foundation, Inc.
License GPLv3+: GNU GPL version 3 or later http://gnu.org/licenses/gpl.html
This is free software: you are free to change and redistribute it.
…
…
(gdb) target remote :3333
After analyzing the manufacturer’s datasheet, we know that the RAM starts at position 0x20000000, the area where the program will be loaded, and we check the memory, obtaining this capture:
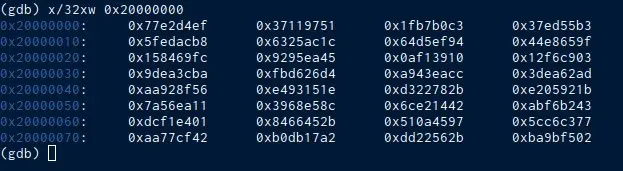
At this point you can start testing the operation of the microprocessor firmware in real time. To use GDB the most common commands are: setp, next, continue, disas, nexi, break and step in. Since you don’t have the code or the software compiled with symbols this process will be a bit cumbersome, but with some practice it ends up being intuitive for the user.
2.4. Frida

It is a dynamic instrumentation toolkit focused on development, reverse engineering, and cybersecurity. It allows injecting JavaScript snippets or a proprietary library into native applications on Windows, macOS, GNU/Linux, iOS, Android and QNX. Frida also provides some simple tools built on top of the Frida API that can be used as-is, tailored to the needs of the researcher, or serve as examples of how to use the API.
This script injection capability facilitates the analysis in black box projects. Common use cases include function tracking, spying on cryptographic APIs or tracing application code (without the source code). Regarding the compatibility and accessibility of the tool, it is free and open-source software, works on Windows, macOS, GNU/Linux, iOS, Android and QNX.
2.5. Qiling

The Qiling emulation framework, already introduced in chapter 6, can be used for the instrumentation of an executable. The design goal of Qiling is precisely to serve as an instrumentation and reverse engineering platform, so it implements many of the necessary functionalities, as well as an API to interact with from a programming language.
It is based on the Unicorn framework and implemented in Python, so the emulation and instrumentation is done through scripts in which the parameters are set, as is the case of the example in the manual:
from qiling import Qiling
from qiling.const import QL_VERBOSE
if name == “main”:
# set up command line argv and emulated os root path
argv = r’examples/rootfs/netgear_r6220/bin/mini_httpd -d /www -r NETGEAR R6220 -c **.cgi -t 300′.split()
rootfs = r’examples/rootfs/netgear_r6220′# instantiate a Qiling object using above arguments and set emulation verbosity level to DEBUG.
# additional settings are read from profile file
ql = Qiling(argv, rootfs, verbose=QL_VERBOSE.DEBUG, profile=’netgear.ql’)
# map emulated fs ‘/proc’ dir to the hosting os ‘/proc’ dir
ql.add_fs_mapper(‘/proc’, ‘/proc’)
# do the magic!
ql.run()
In addition to emulation and having its own debugger, Qiling can connect to a debugger client to control the execution flow or call tools such as AFL from within the script, making it much easier to run tests at runtime.
3. Tracing
Logging the system calls made or traced by a program is one of the most useful techniques for both developers and analysts when debugging software. In many cases, the most critical tasks of an executable require interaction with the kernel, so observing the system calls can reveal a lot about its behavior.
The most used tool to obtain system calls is strace, which, in turn, makes use of the ptrace system call. As an example of its use, you can see the result of running it with whoami:
$ strace -ostrace.txt whoami
userstrace.txt:
…
geteuid() = 1000
…
openat(AT_FDCWD, “/etc/passwd”, O_RDONLY|O_CLOEXEC) = 3
…
lseek(3, 0, SEEK_SET) = 0
read(3, “root:x:0:0::/root:/usr/bin/nolog”…, 4096) = 1849
close(3) = 0
…
write(1, “dummy\n”, 6) = 6
…
Among others, there are calls to geteuid, openat, read, and write, so you can see that whoami queries the user’s UID and the user database in /etc/passwd, checks which user the UID corresponds to, and returns it to stdout. As can be seen, strace allows in many cases to know the basic operation of an executable without the need to do a complete debugging.
In addition to strace, the Linux kernel offers event, interrupt and MMIO tracing capabilities through ftrace. To use ftrace to analyze an executable, userspace tools such as trace-cmd or KernelShark, which allows logging kernel events during the execution of the executable, can be used. More information can be found in the trace-cmd manual.
4. Logging
Although these techniques are less useful, on Unix systems, various logging systems are generally enabled.
Sometimes observing the execution logs of some live services can provide information on what actions they perform or their status.
In case of having the ability to cause failures in some executable, it is also interesting to enable the “coredumps” in the kernel, which will save a copy of the state of the executable when a failure occurs for later analysis, for example, with gdb:
$ gdb executable file_coredump
There are many tools and techniques to apply during dynamic analysis and it is, in general, a costly process in terms of time and effort, so it is essential to previously choose the executables and processes of interest for the analysis. To do this, the results of the previous phases must be evaluated and the components that are most likely to create vulnerabilities must be assessed.
It is crucial to understand how these techniques enable a deeper study through which complex vulnerabilities that would be very difficult to detect with other analysis techniques can be discovered and confirmed.
References
https://learn.microsoft.com/es-es/dotnet/framework/debug-trace-profile/tracing-and-instrumenting-applications
https://frida.re/
https://c.a.segger.com/fileadmin/images/products/J-Link/J-Link_PRO/j-link_pro_500.png.webp
https://github.com/longld/peda
https://www.st.com/bin/ecommerce/api/image.PF271415.en.feature-description-include-personalized-no-cpn-large.jpg
https://www.st.com/bin/ecommerce/api/image.PF260945.en.feature-description-include-personalized-no-cpn-large.jpg
https://qiling.io/2022/08/10/intro/
https://www.trace-cmd.org/
https://kernelshark.org/
This article is part of a series of articles about OWASP
- OWASP methodology, the beacon illuminating cyber risks
- OWASP: Top 10 Web Application Vulnerabilities
- IoT and embedded devices security analysis following OWASP
- OWASP FSTM, stage 1: Information gathering and reconnaissance
- OWASP FSTM, stage 2: Obtaining IOT device firmware
- OWASP FSTM, stage 3: Analyzing firmware
- OWASP FSTM, stage 4: Extracting the filesystem
- OWASP FSTM, stage 5: Analyzing filesystem contents
- OWASP FSTM step 6: firmware emulation
- OWASP FSTM, step 7: Dynamic analysis
- OWASP FSTM, step 8: Runtime analysis
- OWASP FSTM, Stage 9: Exploitation of executables
- IoT Security assessment
- OWASP API Security Top 10
- OWASP SAMM: Assessing and Improving Enterprise Software Security
- OWASP: Top 10 Mobile Application Risks